

Reimagining the Basin Threshold Tool for What Comes Next
How much water does a river actually need to stay healthy? And what data do we need to help sustainability leaders at companies answer that question not just for one river, but across the hundreds of places around the world in its supply chain?
The World Wildlife Fund (WWF) and the Science Based Targets Network (SBTN) have spent years developing methods to help companies understand freshwater sustainability needs, bringing together scientific studies, geographic information, and data from watersheds around the world. But developing a scientifically sound approach is only part of the challenge. The information to put it into practice also has to be assembled, connected, and made available at scale.
Earlier versions of the WWF’s Basin Threshold Tool (BTT) organized information in spreadsheets. Using that evidence could require GIS analysis and cumbersome data preparation, all while trying to maintain shared understanding across a cross-disciplinary team. That makes the BTT not only an interesting freshwater data integration challenge, but an interesting knowledge challenge. How do you turn complex information from many sources into something people can actually use, while preserving where that information came from, what it means, and how it fits together?
Over the past year, the Center for Geospatial Solutions (CGS) has been working with WWF and the Lincoln Institute of Land Policy to do exactly that. Together we transformed the BTT into an open, online platform that makes it much easier to understand freshwater needs at the basin level and put that information to work without losing the science, methodology, and source information behind the results.
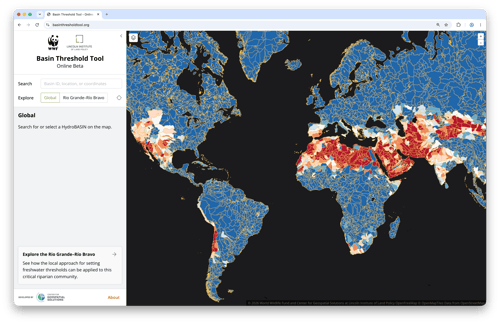
Explore freshwater thresholds across river basins worldwide with the Basin Threshold Tool. Try the tool at basinthresholdtool.org.
What’s under the hood?
One of the most important parts of this work sits underneath what users see on the screen. Rather than treating the 1,346 local environmental-flow assessments assembled for the BTT as inputs for a single application, our team built the platform around a knowledge graph that connects information about places, water systems, scientific studies, methodologies, and the data derived from them.
That approach builds on lessons from our work with Geoconnex, an open data system developed to bring the Internet of Water Coalition’s vision to life. Geoconnex makes water data published by different organizations easier to discover and connect, creating links across information that might otherwise live in separate systems.
A knowledge graph brings that same idea of connected information into the foundation of the BTT. Instead of simply storing individual pieces of data, it captures the meaning and relationships among them: which observations apply to which places, which studies and methods produced particular findings, and how those pieces of information relate to one another. Those connections travel with the data rather than existing only inside the application built to display it.
Why does that matter?
A huge amount of valuable environmental data is collected or assembled to answer one particular question, build one particular application, or fulfill one particular project need. When the project ends, the connections among those datasets — and the knowledge required to interpret them — can be difficult to carry forward.
At CGS, we build differently. By preserving relationships among the underlying information, the BTT's data infrastructure can support the tool people use today while creating a stronger foundation for what comes next. As freshwater science evolves, new information can be incorporated. As new questions emerge, those connections can support other applications and analyses rather than requiring the same data work to begin again from scratch.
That's an important part of what we mean at CGS when we talk about moving beyond single-use data. We’re not simply putting more information online, but building data infrastructure that allows knowledge to be connected, reused, and extended. For our partners, that means we're thinking beyond the immediate deliverable. We want to build the tool they need today while leaving behind data and infrastructure that can continue creating value as their work, the science, and the questions they're asking evolve.
From infrastructure to decisions
Ultimately, most people using the BTT won't ever need to think about its knowledge graph. They'll see an online tool that helps them explore freshwater conditions, understand basin-level thresholds, and connect those results back to the evidence behind them. Like great front-end design, good data infrastructure should make complicated things feel simpler. It should preserve the richness and provenance of the information underneath while making it easier for someone to answer the question in front of them — and capture that knowledge in ways that make the next question easier to answer, too.
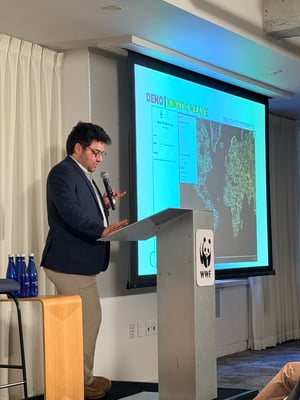
CGS’s Kyle Onda demonstrates the Basin Threshold Tool at WWF’s Panda House during its debut at Climate Week NYC.
The BTT launched last week at Climate Week NYC, amid conversations about how we use resources today while protecting what we’ll need tomorrow. We think about data in much the same way.
Too often data products are built for a single use. They answer one question, serve one project, or feed into one application. The BTT shows another possibility. The tool meets an immediate need, but the infrastructure underneath it is designed to evolve, connect, and support questions we haven't yet thought to ask.
For us, that's what “sustainable” data looks like: useful today and built ready for whatever comes next.